[ad_1]
Good morning. We don’t break years into thirds, but if we did, we’d be saying “the first third was just awful for stocks”. The S&P 500 hit its all-time high on January 3 — opening day for markets — and is down 14 per cent since then. Today I take the measure of what happened: where the damage was done and by what. Tomorrow I’ll turn to what is next.
Ouch
A good way to take the profile of the miseries of 2022 is by looking at sector performance:

That is a picture of inflation taking hold, as evidenced by energy stocks’ great showing, and investors moving into a defensive crouch, keeping staples and utilities flat while sectors that have done the best in recent years, paradigmatically tech, sell off hard.
Technology, broadly construed, has its fingerprints all over the worst performing sectors. Netflix (-68 per cent year to date) Google (-23) and Facebook (-15) make up 40 per cent of the communications sector. Amazon (-25) and Tesla (-6.5) make up half of the consumer discretionary sectors. Fully half the stocks in the information technology sector are down by 20 per cent or more.
(As a reminder: Unhedged is very sceptical of the “tech is selling off because rates are rising and tech stocks are long duration assets” narrative; see here. Instead, we think that (a) small tech stocks are risky and risk is selling off and (b) big tech stocks have done incredibly well, and so some hard profit-taking was inevitable as growth slows.
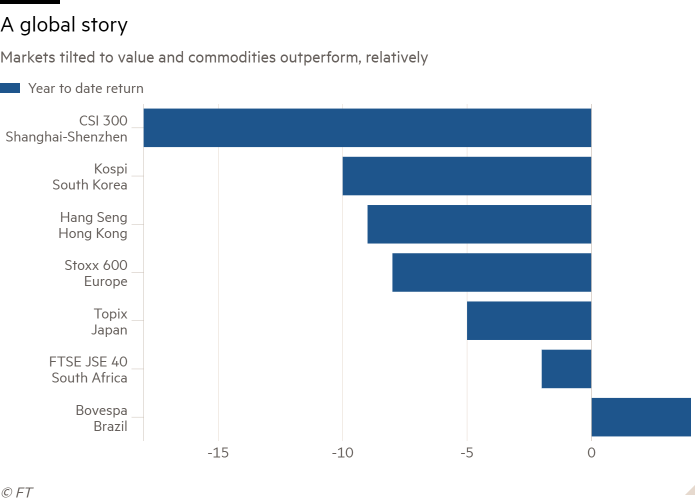
The only relative bright spot in US markets has been value. The Russell 1000 value has fallen a mere 6 per cent, while its growth oriented sister index is down 20 per cent. The US pattern extends to international stocks, where value-tilted markets such as Europe and Japan have taken less pain and commodity-oriented markets, notably Brazil, have outperformed.

It’s the Fed, mainly
As we have argued before, the main culprit is obvious enough. Inflation is out of control and the Fed, after some delay, is coming out guns blazing. Market expectations for where the Fed funds rate will end the year have roughly tripled since the start of the year, from around 100 basis points to around 300. This has flattened the yield curve from 5 to 30 years, and almost flattened the 2-year 30-year. The Fed aims to cut inflation by slowing demand — reducing job creation, lowering investment, cooling consumption — and the yield curve says it will work:

Already the Fed’s signalling is having an effect. Mortgage rates have passed 5 per cent, from 3 at the start of the year. Mortgage applications and new home sales are falling. The dollar is stronger against everything, which will drag on manufacturing before long. Manufacturing and services PMI indices are grinding lower.
The Fed’s success in dimming the economic outlook has left markets feeling seriously jumpy. A chart from Citi showing volatility in stocks, bonds and the dollar:
Other factors
The Fed has had two main accomplices in its assault on the stock market. The Chinese government’s Covid policies are first among them. This striking chart from Gavekal Dragonomics shows how exports, production, consumption, investment, and real estate have all taken a hit:
Capital Economics’ China team thinks that China is not growing as fast as the official figures suggest, and that the economy will grow in real terms this year. Its China activity proxy uses figures including car and machinery sales, freight traffic, and property sales to provide a common sense alternative to government figures. It turned down sharply last month:
China’s slowdown creates a headwind to global growth, and makes it harder for the sectors that might otherwise do well in a defensive and inflationary environment — such as materials and cyclically sensitive value stocks.
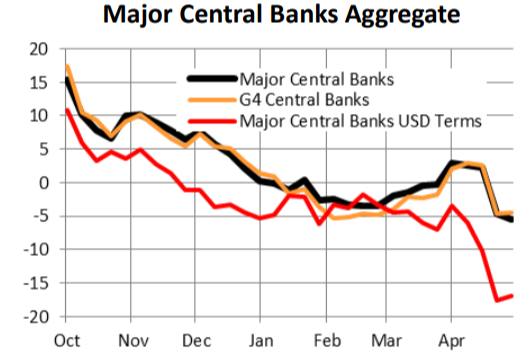
The Fed’s other key accomplice is falling liquidity in the financial system, which nearly always drags down risk asset prices. Matt King at Citibank calls what has happened “sudden stealth quantitative tightening” as the Treasury’s general account rises (meaning taxes are being taken in by the Federal government and equivalent amounts are not being distributed) and the Fed’s reverse repo operations pull liquidity out of the financial system, as well. Here is a chart from the liquidity mavens at CrossBorder Capital, showing how declining liquidity in the US (with some help from tightening in China and the UK) effects the 3-month change in aggregate liquidity provision by all major central banks:
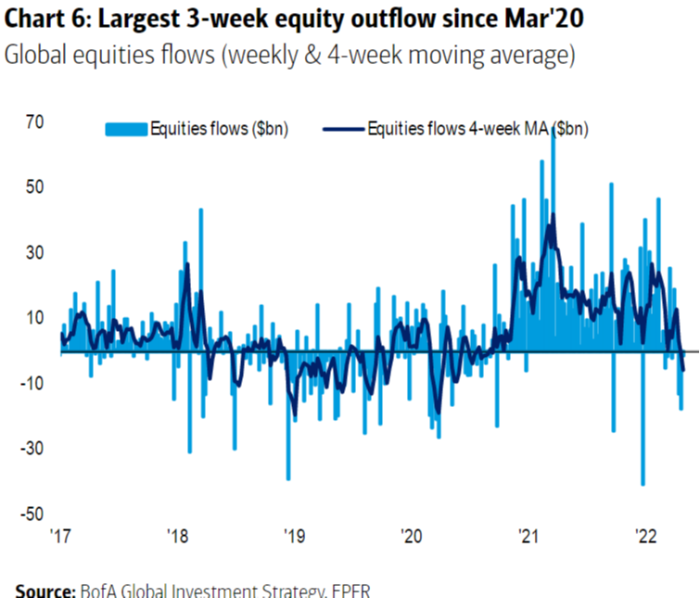
Investors are getting the message as the Fed attacks demand, China becomes a drag on global growth momentum, and liquidity is drained from the system. After a long period of investor inflows to equity ETFs and Mutual funds, cash is now being pulled out, as this chart from BofA’s Michael Hartnett shows:
Are we nearing the bottom — defined as a point where indicators of economic activity, liquidity, and investor sentiment can fall no lower, and can begin to rebound? Much depends, of course, on whether inflation has peaked, giving the Fed an opportunity to move more gradually with rate hikes and reducing its bond portfolio. This is the more or less rosy scenario markets appear to be pricing in. We will consider the question in more detail tomorrow.
One good read
A nice Lunch with the FT with the psychologist Jonathan Haidt. His book The Righteous Mind really changed the way I think about politics, the media, and even markets.
[ad_2]
Source link


Comments are closed.